Analytics

The SOLARWATT Manager portal makes the processes and data of the Manager visible to you via the Internet - on your computer, tablet or smartphone. This means you can access your energy data from anywhere and at any time. Thanks to SSL encryption (online banking standard), your data is of course absolutely secure.
The Analytics menu is divided into the categories Overview, Consumption, Production, Storage, Independence and Finances.
You can analyze your system in terms of power [kW] (current value) and work [kWh] (value over selected period).
The selected time period is shown on the x-axis. The y-axis shows the value range - power or work - of the selected category.
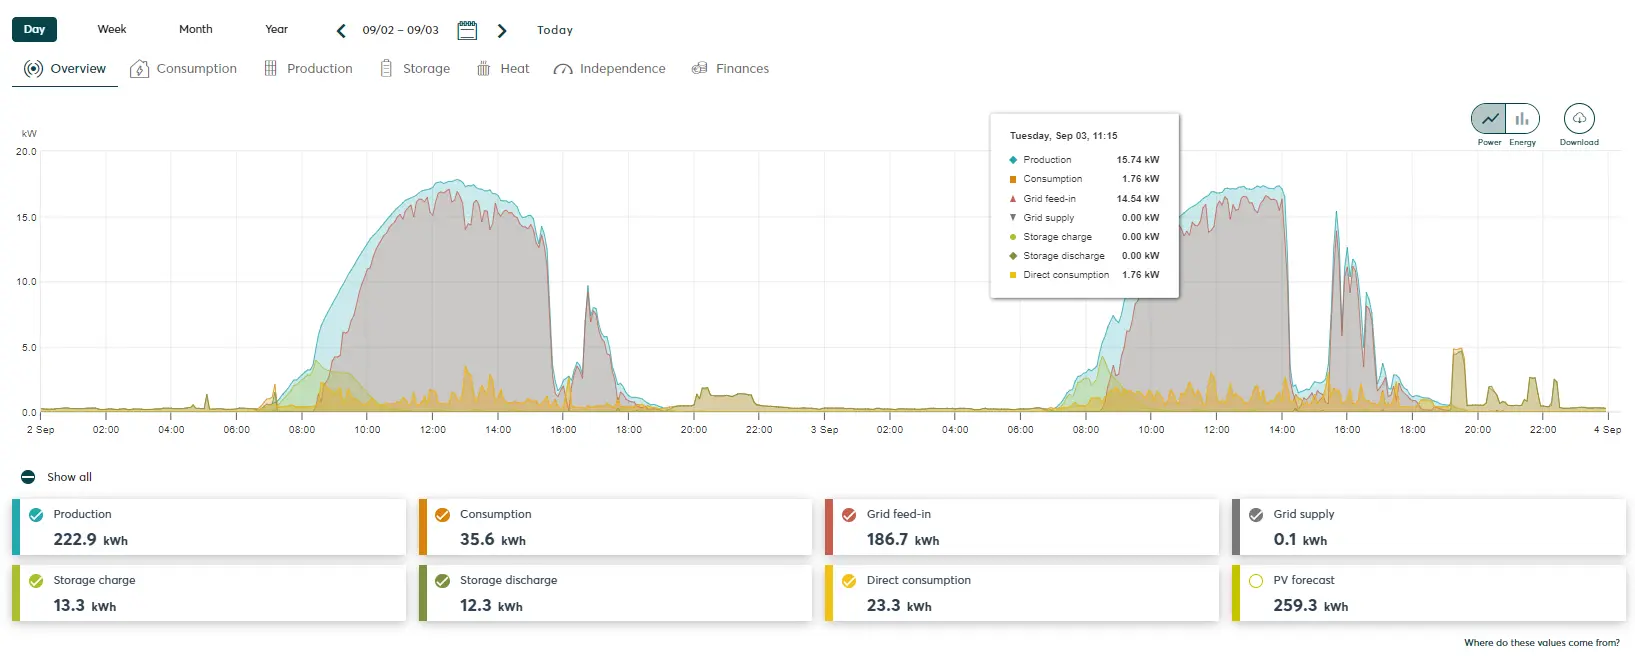
The detailed analysis shows a diagram in which you can select settings yourself by selecting or deselecting the checkboxes in the legend.
The values shown in the legend correspond to the work values for the selected period.
If you move the mouse pointer over the data in the diagram, an info box opens showing the exact values (time or time period and power or work) for intervals of five minutes.
You can also create a energy plant report for your system (for each year of operation) and export the data (as a csv file).
Overview
The Overview tab shows you data on your PV production and consumption. Data on feed-in and storage is also displayed. The switchable parameters give you a detailed insight into the energy flows of your household.
The PV production forecasts (PV forecast) are calculated on the basis of location information, orientation of the PV plants, nominal power (kWp) and weather information. No historical data is included in the forecast.
Consumption
The Consumption tab shows your electricity consumption broken down into the loads in your energy system. It also shows how much of the electricity consumed was drawn from the grid, from a battery or directly from the PV plants. This overview shows all meters and special measurable loads that are connected to your energy system.
The consumption analysis at the bottom of the tab lists all switchable loads individually and all other devices combined. The list shows you the activity of the devices and their contribution to total consumption.
Production
The Production tab shows you how much electricity you have generated, saved, fed into the grid and consumed. You can also display the data for the PV forecast.
If your installation contains several inverters, their generation data can be displayed separately. This requires the SOLARWATT Manager to be configured accordingly.
Storage
The Storage tab shows you all the devices in your energy system that can save and release electricity. The electricity stored and drawn by the device is displayed for each device. The power view also shows the state of charge of the battery system.
Heat
The water temperature is displayed for the following devices: EGO Smart Heater, My PV ELWA, Stiebel Eltron heat pump in combination with the additional thermal energy management function.
You can select the temperature unit used for the display in the user settings.
Independence
The Independence category shows you the proportion of your household's electricity supply that is independent of the grid (self-sufficiency) and the proportion of self-produced electricity that you consume yourself (self-consumption rate).
Finances
The Finances tab shows you the electricity costs incurred through grid procurement and the income received through feeding into the electricity grid. The additional financial benefit shown represents the electricity costs avoided through self-consumption.
You can enter the amount of the feed-in tariff and your electricity tariff in the user settings. This is the prerequisite for a correct calculation of the financial parameters.